What Are You Looking For?
Testing Methods Determine Material Grades: Methodological Differences in Particle Size and Purity Testing of Boron-Based Materials
Introduction
In the international procurement of boron-based materials, purchasing engineers frequently encounter a confusing phenomenon: identical batches of boron materials yield drastically different test results when examined via disparate testing protocols. Particle size readings can shift from "non-compliant" to "qualified", while purity grades may swing from 6N to 4N. This raises a critical question: are these discrepancies caused by the material itself, or by the testing methodologies employed?
Drawing on two real-world testing cases, this paper analyzes the gaps between Scanning Electron Microscopy (SEM) and laser particle size analyzers for particle size measurement, as well as the divergent outputs of ICP-MS and GDMS purity testing. It aims to help customers establish rigorous testing awareness and avoid flawed procurement judgments stemming from misinterpreted test data.
I. Particle Size Testing: Why SEM and Laser Particle Size Analyzer Deliver Contradictory Results
1. Case Study: 2–4 μm Boron Powder Misjudged by SEM
A South Korean client purchased amorphous boron powder with a contractual particle size specification of 2–4 μm. When inspected under a Scanning Electron Microscope (SEM), severe particle agglomeration was observed, leading the client to deem the product non-conforming.
However, re-testing conducted by BoronHub using a laser particle size analyzer, with standard pre-treatment including sodium pyrophosphate dispersant and ultrasonic de-agglomeration, produced D50 values fully within the 2–4 μm target range, confirming the product meets specifications.
Why do two testing techniques produce opposing conclusions for the same batch of material?
2. Fundamental Principle Differences: Visual Imaging vs. Statistical Distribution
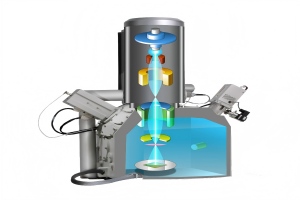
Scanning Electron Microscopy (SEM) SEM scans the sample surface with a focused high-energy electron beam to generate high-resolution morphological images. It enables direct observation of particle shape, surface structure and agglomeration status, making it invaluable for material R&D and morphological analysis. Nevertheless, it carries notable limitations:
No capacity for full distribution statistics: SEM only captures several hundred particles within a limited field of view, which cannot represent the true particle size distribution of an entire powder batch.
High risk of agglomeration misjudgment: For readily agglomerated boron powder, SEM imagery confuses agglomerates with large primary particles and cannot distinguish genuine coarse grains from clustered particles.
Substantial quantitative error: Measurement deviations for primary particles via SEM can reach 15%–30%.
Laser Particle Size Analyzer This instrument operates on laser diffraction principles (ISO 13320:2020). As particles pass through a laser beam, light scattering occurs; the device calculates volumetric particle size distribution based on the angle and intensity of scattered light. As a statistical testing technique, it rapidly and accurately characterizes the overall particle size distribution of a sample, outputting critical metrics including D10, D50 and D90. Within the elemental boron industry, laser particle size analysis is the standard routine testing method and globally accepted acceptance criterion.
3. Core Conclusion
SEM captures the morphology of individual particles, while laser particle size analyzers generate statistical distribution data for the bulk powder population.
For boron powder used in semiconductor doping, production processes prioritize consistent overall particle size distribution (quantified via D10, D50, D90) rather than the morphology of isolated particles. Accordingly, laser particle size analysis complying with ISO 13320:2020 is the internationally recognized standard for particle size acceptance testing. SEM is only suitable for morphological observation and shall not be used as a basis for batch rejection.
4. Practical Guidance for Buyers
Clarify acceptance metrics: Require suppliers to provide D10, D50 and D90 data instead of vague "XX micron" specifications.
Specify testing methodology: Explicitly designate laser particle size analysis (ISO 13320) as the sole acceptance standard within contracts or specification sheets.
Verify pre-treatment protocols: Confirm the use of dispersants and ultrasonic de-agglomeration standard pre-treatment for agglomeration-prone powders.
Treat SEM as auxiliary only: SEM may be used for morphological and agglomeration observation but cannot independently justify product rejection.
II. Purity Testing: Discrepancies Between ICP-MS and GDMS Grading
1. Case Study: 6N or 4N? Determined by Test Element Scope
A batch of 6N crystalline boron recorded total concentrations of 11 key impurities below 1 ppm via ICP-MS testing, corresponding to a stated purity of 99.9999% (6N).
Yet identical material analyzed via GDMS detected over 70 impurity elements with a total impurity concentration exceeding 10 ppm, equating to a purity grade of only 99.99% (4N).
The material composition remains unchanged, yet its purity rating drops drastically—what accounts for this disparity?
2. ICP-MS: Globally Accepted Standard for 6N Certification in the Semiconductor Industry
Within the high-purity elemental boron sector, 6N purity classification is defined by ICP-MS testing of a defined set of critical impurity elements, rather than full-spectrum elemental screening.
Below are the standard ICP-MS test specifications for BoronHub’s 6N crystalline boron:
| Element | Specification Limit | Test Method |
| Al | ≤ 0.4 ppm | ICP-MS |
| As | ≤ 0.5 ppm | ICP-MS |
| Cr | ≤ 0.2 ppm | ICP-MS |
| Cu | ≤ 0.3 ppm | ICP-MS |
| Fe | ≤ 0.9 ppm | ICP-MS |
| k | ≤ 0.7 ppm | ICP-MS |
| Mg | ≤ 0.5 ppm | ICP-MS |
| Na | ≤ 0.5 ppm | ICP-MS |
| Ni | ≤ 0.1 ppm | ICP-MS |
| Pb | ≤ 0.1 ppm | ICP-MS |
| Sb | ≤ 0.1 ppm | ICP-MS |
| Total Impurities | < 1.0 ppm | - |
Inductively Coupled Plasma Mass Spectrometry (ICP-MS) uses liquid sample injection to precisely quantify heavy metal impurities hazardous to semiconductor devices (e.g., Fe, Cu, Ni, Pb). Material with total concentrations of these specified impurities below 1 ppm qualifies as 6N purity—this is the universal acceptance standard adopted by semiconductor wafer fabs worldwide.
3. GDMS: Comprehensive Full-Spectrum Element Screening Tool
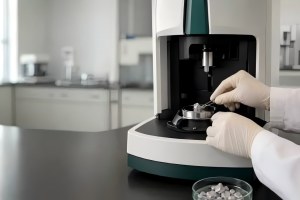
Glow Discharge Mass Spectrometry (GDMS) enables direct solid sample analysis and detects up to 70 impurity elements spanning nearly the entire periodic table, including alkali metals, rare earths and non-metallic contaminants.
GDMS screens a far broader range of impurities than ICP-MS. Even with each individual impurity present at ultra-low concentrations, cumulative total impurity levels will inevitably rise, which may reduce the calculated purity to 4N when accounting for all trace elements. This does not indicate inferior material quality—the chemical composition remains identical; only the statistical scope differs.
ICP-MS quantifies concentrations of predefined harmful elements to validate compliance with 6N grading. GDMS delivers a full elemental impurity profile for research traceability and comprehensive material characterization.
4. Functional Division and Positioning of the Two Testing Methods
| Comparison Item | ICP-MS | GDMS |
| Sample Injection Mode | Liquid injection (sample dissolution required) | Direct solid injection |
| Detected Elements | 11 key semiconductor-hazardous impurities | Up to 70 elements (full-spectrum screening) |
| Detection Limit | ppb level | ppb level |
| Industrial Application | Universal standard for 6N purity certification | Full-element traceability & R&D analysis |
| Applicable Scenarios | Factory release testing, incoming material inspection | Material research, anomaly troubleshooting |
5. Practical Guidance for Buyers
Define 6N clearly: 6N grading refers to total concentrations of the specified 11 critical impurities below 1 ppm, not full-spectrum elemental purity.
Request complete test reports: Demand numerical measured values (ppm/ppb) for each element instead of merely a "6N" label.
Standardize acceptance methodology: Adopt ICP-MS as the benchmark for batch acceptance, consistent with industry-wide 6N grading norms.
Deploy GDMS for R&D purposes: Request supplementary GDMS full-element analysis reports for research or anomaly investigation if required.
III. Complete Practical Operation Manual for Purchasers and Engineers
5-Step Particle Size Testing Protocol
| Step | Core Requirements |
| 1. Clarify Metrics | Require D10, D50, D90 data instead of vague micron-range descriptions |
| 2. Specify Test Method | Contractually designate laser particle size analysis (ISO 13320) as the sole acceptance standard |
| 3. Confirm Pre-Treatment | Verify dispersant type (e.g., sodium pyrophosphate), ultrasonic duration and dispersion parameters |
| 4. Request Distribution Curves | Demand full particle size distribution plots, not isolated single numerical values |
| 5. Restrict SEM to Reference Use | SEM serves only morphological observation and cannot act as particle size acceptance criteria |
4-Step Purity Testing Protocol
| Step | Core Requirements |
| 1. Understand 6N Definition | 6N grading relies on ICP-MS testing of 11 predefined critical impurities, not full-spectrum elemental analysis |
| 2. Confirm Test Benchmark | Acceptance testing shall reference ICP-MS; GDMS is reserved for full-element traceability |
| 3. Obtain Full Quantitative Data | Request individual element readings and total impurity content, not just percentage purity values |
| 4. Demand Original COA Documentation | Reports must specify testing instruments, methodologies, detection limits and individual element concentrations |
IV. BoronHub’s Testing Standards and Commitments
As a professional supplier of advanced boron-based materials, BoronHub adheres to the strictest international testing standards:
1.Particle Size Testing: Laser particle size analyzers compliant with ISO 13320:2020, paired with standardized pre-treatment (sodium pyrophosphate dispersion + ultrasonic de-agglomeration), ensuring repeatable, internationally comparable particle size data.
2.Purity Testing: Every batch of 6N-grade material undergoes ICP-MS analysis for 11 key impurities with total aggregate levels below 1 ppm, accompanied by complete COA documentation. GDMS full-element analysis reports are available upon customer request for R&D reference.
3.Transparency Commitment: All reports clearly disclose testing methodologies, the scope of analyzed elements and individual measured values to eliminate ambiguous labeling.
4.Traceable Data: All test certificates document testing protocols, detection limits and reference standards, with full traceability back to batch production records
Conclusion
The choice between SEM and laser particle size analysis, or ICP-MS and GDMS, ultimately hinges on how manufacturers and buyers define "conforming material". Identical raw materials can yield vastly different test outcomes under divergent analytical methods—this is not material inconsistency, but a limitation inherent to each testing technique. Within the boron materials sector, laser particle size analysis is the universal particle size testing benchmark, while targeted ICP-MS impurity testing constitutes the industry standard for 6N purity certification.
Sound procurement decisions are built upon a thorough understanding of testing methodologies.
When partnering with BoronHub, customers receive not only high-purity boron materials, but also a fully traceable, verifiable and robust quality assurance framework.
BoronHub – Defining High-Purity Boron Quality Through Scientific Testing
To obtain specification sheets (TDS/COA) for 6N boron products or enquire about testing methodology details, please contact our technical team.
Scan to wechat :

Scan to Whatsapp :

home
products
Contact Us